Taxon distribution
Taxon occurrences
One of the main objectives of Balearica is to offer a comprehensive visual representation of species distribution across the Balearic Islands. To achieve this, we have integrated data from a range of reliable sources, including publicly accessible databases such as Global Biodiversity Information Facility1, National Center for Biotechnology Information - GenBank23, and Barcode of Life Data Systems - BOLDSystem4, along with scientific and grey literature.
Distribution
Balearica includes both marine and terrestrial areas.
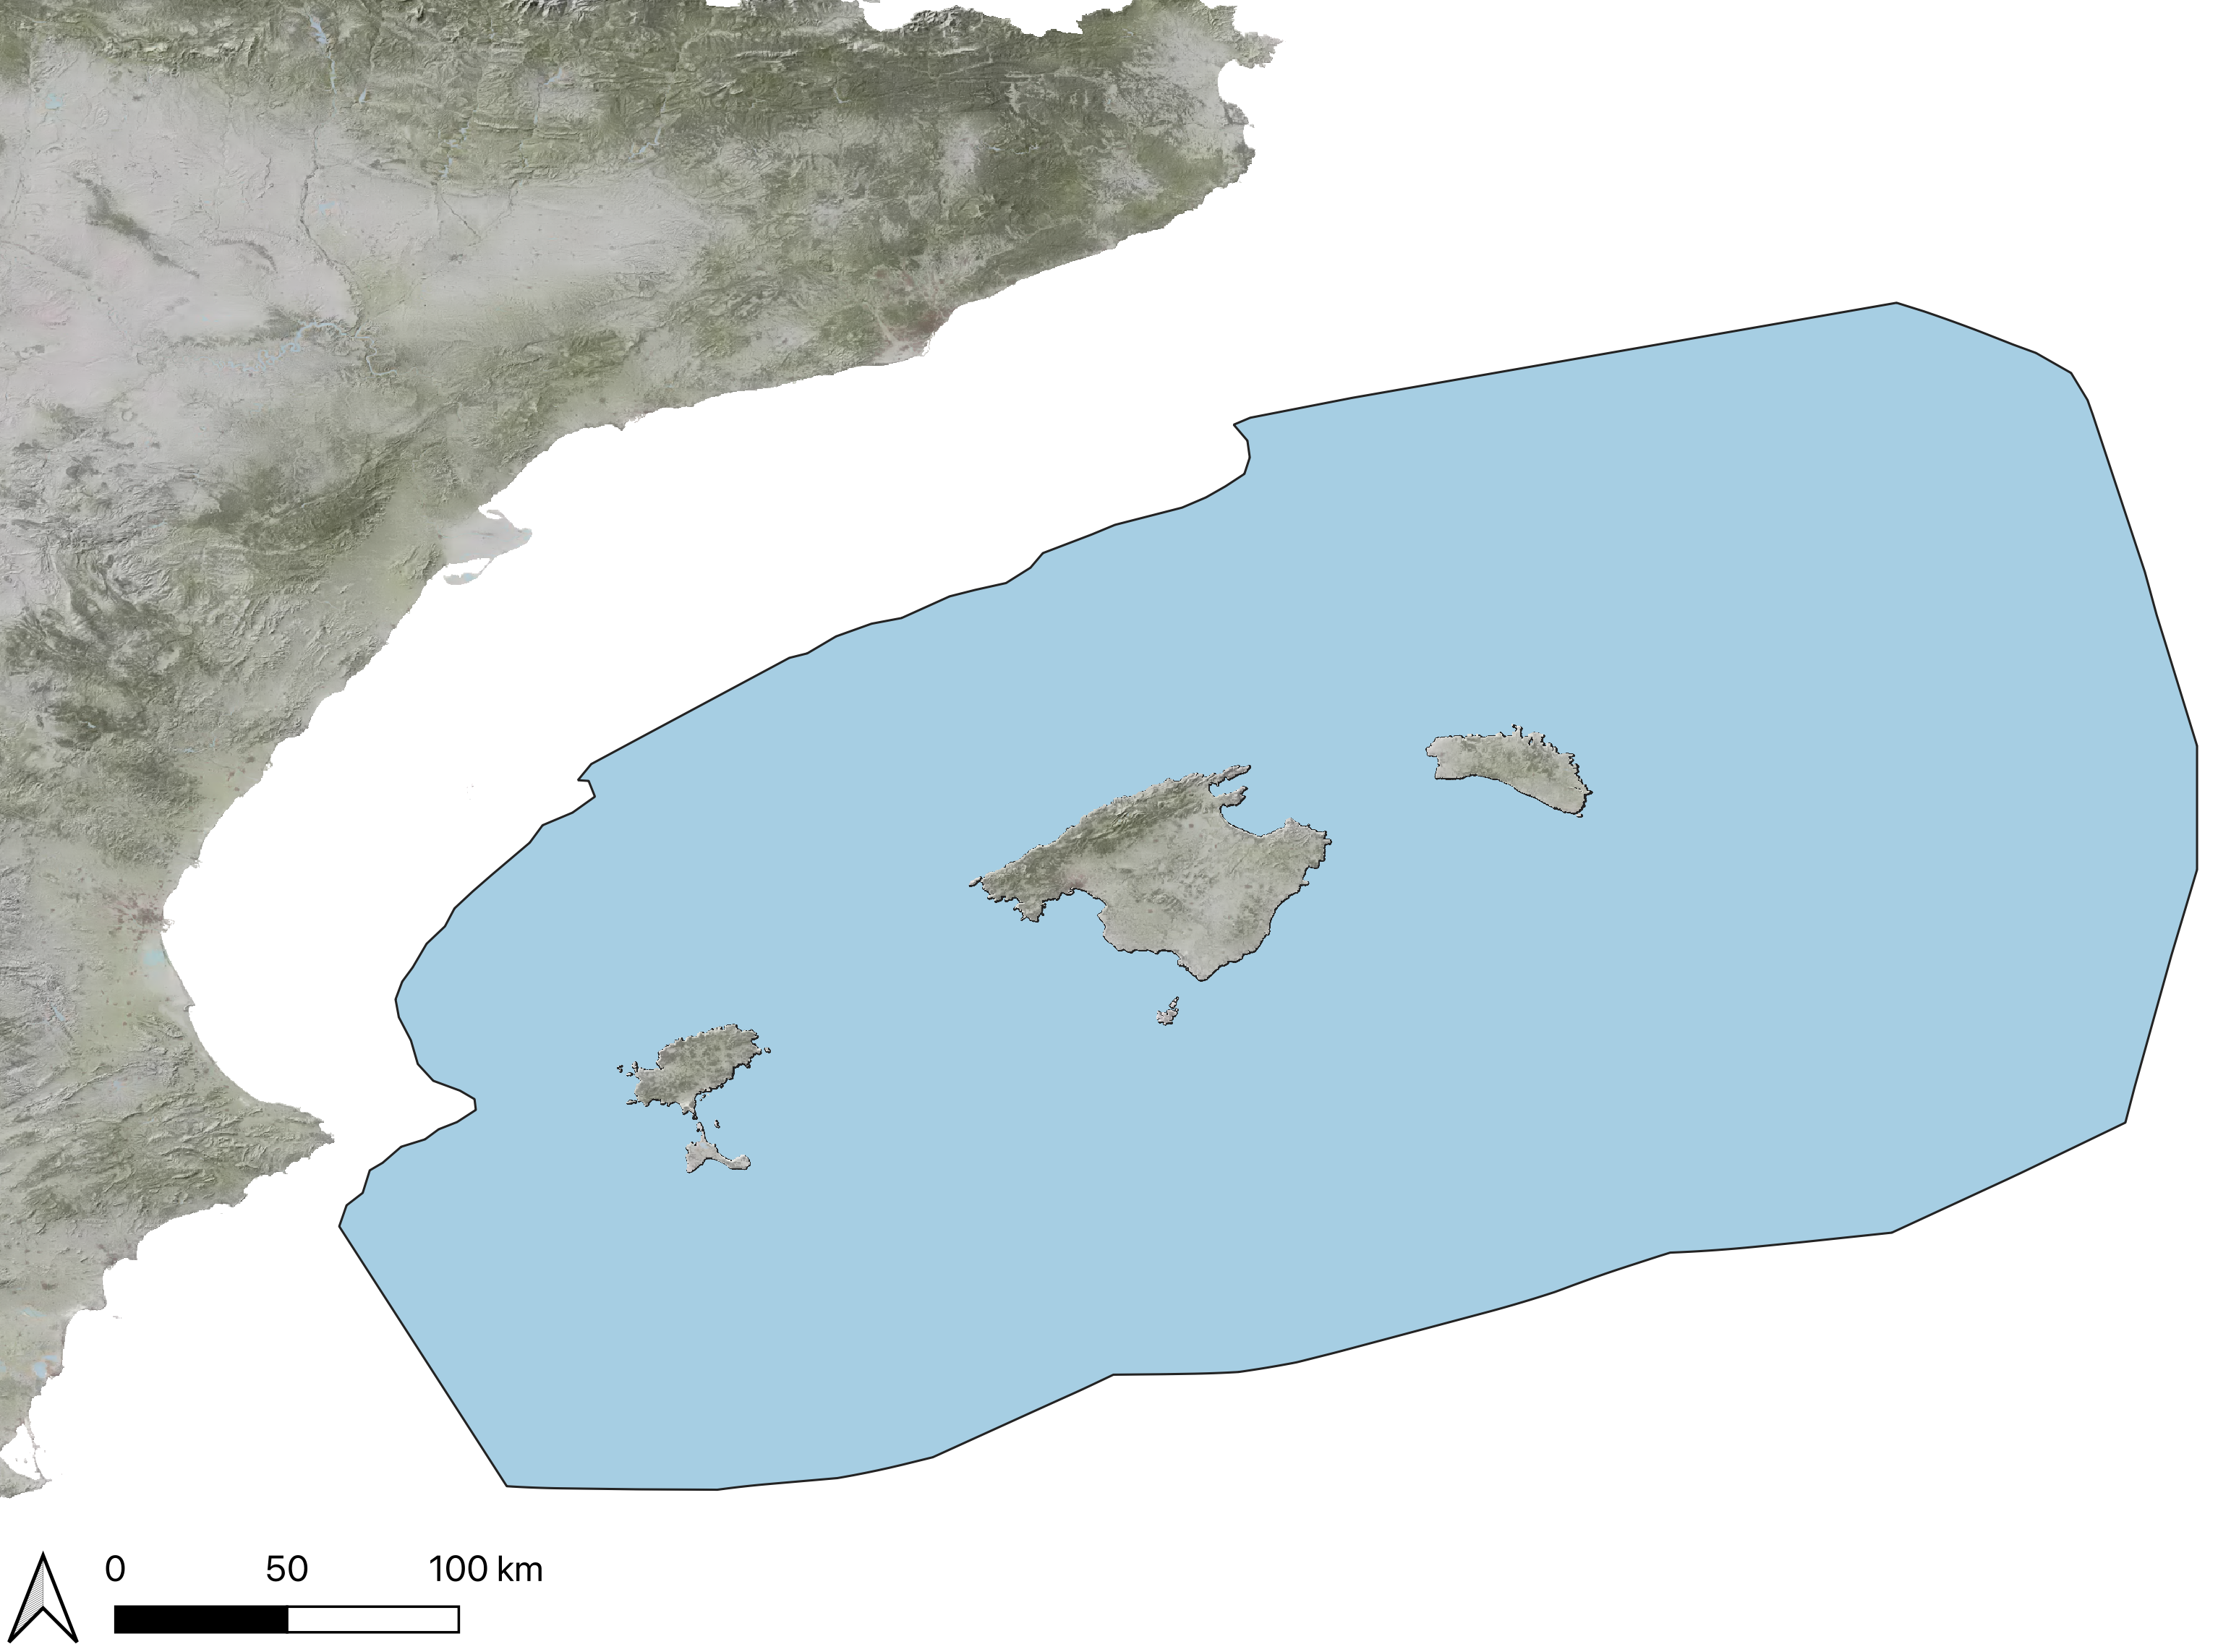
Marine area. The marine area has been custom-defined, starting from the Spanish Exclusive Economic Zone and calculating the midpoints between the Balearic Islands (land) and the Spanish mainland. This methodology was designed to more accurately represent the boundaries of Balearic waters and their distinct ecological characteristics. By using this approach, we ensure the inclusion of the deep-sea areas south of the archipelago, which harbour unique biodiversity, while also preventing the extension of the Balearic marine domain to the mainland coast (Figure 1).
Land territories. The land territories represented on Balearica include the four main Balearic islands — Mallorca, Menorca, Ibiza, and Formentera — as well as several smaller islands and islets, such as Cabrera, Dragonera, Isla del Aire, Tagomago, and others. To improve the precision of species occurrence data filtering, these territories are organized into four hierarchical levels (Table 1).
Tab.1 Hierarchical structure of land territories, including the number of entities, their definitions, and data sources. IDEIB: Infraestructura de Dades Espacials de les Illes Balears; CNIG: Instituto Geográfico Nacional.
| Level | Number of entities | Definition | Source |
|---|---|---|---|
| Autonomous Community | 1 | The entire Balearic Islands region | IDEIB |
| Island | 4 | Individual main islands within the archipelago | IDEIB |
| Municipality | 134 | Administrative divisions within each island | IDEIB |
| Town | 393 | Specific towns or localities within municipalities | CNIG |
In Balearica, we used spatial layers from Infraestructura de Dades Espacials de les Illes Balears (IDEIB) and Instituto Geográfico Nacional (CNIG). This ensures an accurate geospatial representation of land territories for filtering taxa occurrences.
3D map
The 3D model map is an original product, developed using the raster DEM from CNIG, featuring a 2-meter grid resolution5. To enhance quality and visual detail, a LiDAR layer from CNIG was also integrated6.
Statistics
Temporal occurrence histogram
The temporal occurrence histogram represents the frequency of species occurrences over time. The data has been grouped by month.
Source histogram
The source histogram shows how values are distributed based on their specific source.
Accumulation by year
The year histogram of occurrence illustrates the annual frequency of species observations. The accumulation curve represents the cumulative number of occurrences recorded over time.
-
GBIF.org. Gbif home page. 2025. Accessed: 2025-10-14. URL: https://www.gbif.org. ↩
-
E. W. Sayers, J. Beck, E. E. Bolton, J. R. Brister, J. Chan, D. C. Comeau, R. Connor, M. DiCuccio, C. M. Farrell, M. Feldgarden, A. M. Fine, K. Funk, E. Hatcher, M. Hoeppner, M. Kane, S. Kannan, K. S. Katz, C. Kelly, W. Klimke, S. Kim, and S. T. … Sherry. Database resources of the national center for biotechnology information. Nucleic Acids Research, 52(D1):D33–D43, 2024. doi:10.1093/nar/gkad1044. ↩
-
Dennis A. Benson, Mark Cavanaugh, Karen Clark, Ilene Karsch-Mizrachi, David J. Lipman, James Ostell, and Eric W. Sayers. Genbank. Nucleic Acids Research, 41(D1):D36–D42, 11 2012. doi:10.1093/nar/gks1195. ↩
-
S. Ratnasingham, C. Wei, D. Chan, J. Agda, J. Agda, L. Ballesteros-Mejia, H. Ait Boutou, Z. M. El Bastami, E. Ma, R. Manjunath, D. Rea, C. Ho, A. Telfer, J. McKeown, M. Rahulan, C. Steinke, J. Dorsheimer, M. Milton, and P. D. N. Hebert. Bold v4: a centralized bioinformatics platform for dna-based biodiversity data. In DNA Barcoding: Methods and Protocols, chapter 26, pages 403–441. Springer US, New York, NY, 2024. ↩
-
CNIG. Mdt02-cob2. 2021. Accessed: 2025-10-14. URL: https://centrodedescargas.cnig.es/CentroDescargas/home. ↩
-
CNIG. Lidar-pnoa-cob2. 2015. Accessed: 2025-10-14. URL: https://centrodedescargas.cnig.es/CentroDescargas/home. ↩